Polygons

Plotting Polygons
Data Source - Natural Earth
Data Source - OpenFlights (You should already have this from the previous exercise)
In [1]:
import geopandas as gpd

data = gpd.read_file("../resources/NaturalEarth/10m_cultural/ne_10m_time_zones.shp")
countries = gpd.read_file("../resources/NaturalEarth/10m_cultural/ne_10m_admin_0_countries.shp")
data = data.sort_values('name')
print(data.columns)
Index(['objectid', 'scalerank', 'featurecla', 'name', 'map_color6',
       'map_color8', 'note', 'zone', 'utc_format', 'time_zone', 'iso_8601',
       'places', 'dst_places', 'tz_name1st', 'tz_namesum', 'geometry'],
      dtype='object')
In [2]:
import matplotlib.pyplot as plt

fig, ax = plt.subplots(facecolor='#FCF6F5FF')
ax.set_facecolor('#FCF6F5FF')
data.plot(ax=ax, color='#FCF6F5FF', edgecolor='black', lw=1)
plt.show()

Exercise
- Reproject the data map.
- Find a colourmap that highlights the different timezones clearly.
- Plot the worlds borders on top to show how timezones match with country outlines.
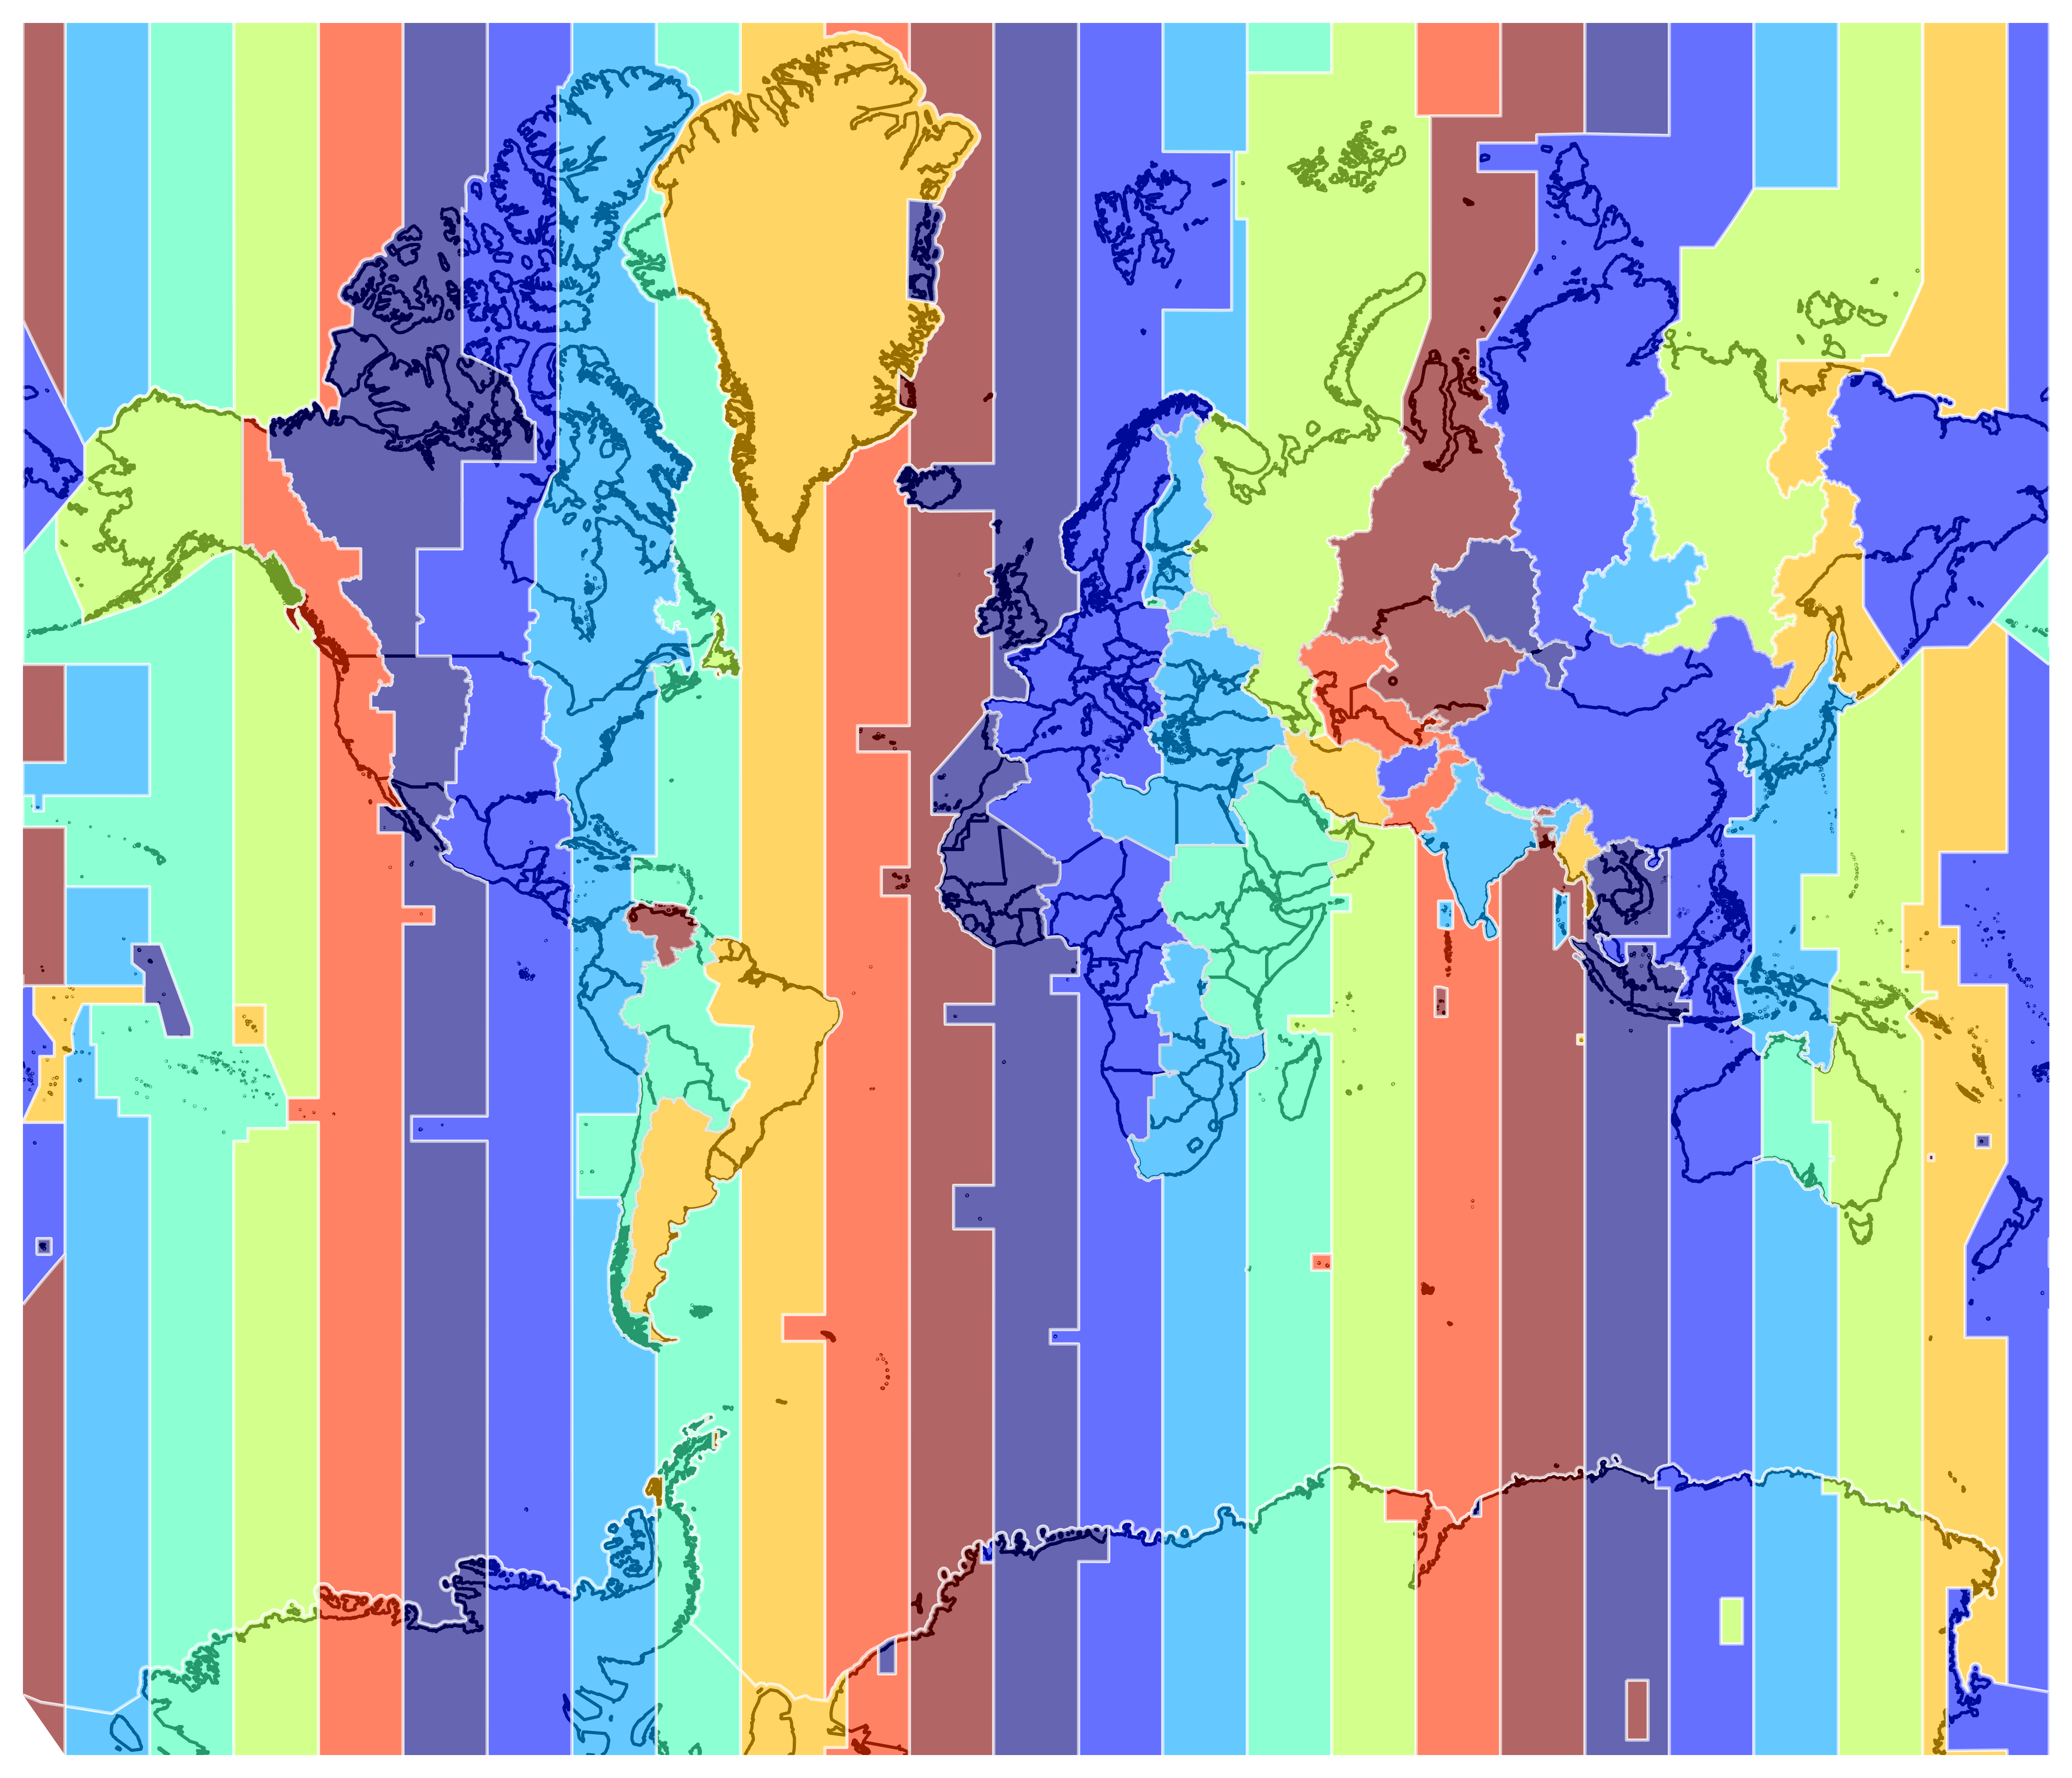
In [3]:
import cartopy.crs as ccrs

fig, ax = plt.subplots(subplot_kw={'projection': ccrs.Mercator()},
                       figsize=(10,10))

countries.plot(ax=ax,
               transform=ccrs.PlateCarree(),
               color='none',
               edgecolor='black',
               lw=1)
data.plot(ax=ax,
          transform=ccrs.PlateCarree(),
          column='map_color8',
          cmap='jet',
          edgecolor='white',
          lw=1,
          alpha=0.6)
ax.axis('off')
plt.show()

Exercise
- Read the roman_empire.geojson and mongol_empire.geojson from the resources folder
- Generate a plot showing both empires
- Isolate the overlap between the two


In [4]:
roman_empire = gpd.read_file("../resources/roman_empire.geojson")
mongol_empire = gpd.read_file("../resources/mongol_empire.geojson")
In [5]:
overlap = roman_empire.overlay(mongol_empire, how='intersection')
In [6]:
fig, ax = plt.subplots(subplot_kw={'projection': ccrs.Mercator()},
                       figsize=(10,10))

roman_empire.plot(ax=ax,
                  transform=ccrs.PlateCarree(),
                  color='crimson')
mongol_empire.plot(ax=ax,
                   transform=ccrs.PlateCarree(),
                   color='blue')
overlap.plot(ax=ax,
             transform=ccrs.PlateCarree(),
             color='green')
ax.axis('off')
plt.show()

Combining Polygons, LineStrings and Points
In this section we will generate a map of all flights that take place between this timezone (Texas) and my timezone (UK)
In [7]:
import pandas as pd

uk = data.loc[data['name'] == '0']
texas = data.loc[data['name'] == '-6']
my_flight = pd.concat([uk, texas])
my_flight.plot()
plt.show()

In [8]:
airports = pd.read_csv("../resources/airports",
                       delimiter=',',
                       names=['id', 'name', 'city', 'country', 'iata',
                              'icao', 'lat', 'long', 'altitude', 'timezone',
                              'dst', 'tz', 'type', 'source'])
In [9]:
routes = pd.read_csv("../resources/routes",
                     delimiter=',',
                     names=['airline', 'id', 'source_airport', 'source_airport_id',
                            'destination_airport', 'destination_airport_id', 'codeshare',
                            'stops', 'equitment'])
In [10]:
from shapely.geometry import Point

geometry = [Point(xy) for xy in zip(airports['long'], airports['lat'])]
airports = gpd.GeoDataFrame(airports, crs="EPSG:4326", geometry=geometry)
In [11]:
new_airports = gpd.sjoin(airports, my_flight, predicate='within')
In [12]:
print(new_airports.columns)
Index(['id', 'name_left', 'city', 'country', 'iata', 'icao', 'lat', 'long',
       'altitude', 'timezone', 'dst', 'tz', 'type', 'source', 'geometry',
       'index_right', 'objectid', 'scalerank', 'featurecla', 'name_right',
       'map_color6', 'map_color8', 'note', 'zone', 'utc_format', 'time_zone',
       'iso_8601', 'places', 'dst_places', 'tz_name1st', 'tz_namesum'],
      dtype='object')
In [13]:
new_airports = new_airports.rename(columns = {'name_left': 'airport_name', 'name_right': 'timezone_name'})
In [14]:
print(new_airports.airport_name.unique())
print(new_airports.timezone_name.unique())
['Akureyri Airport' 'Egilsstaðir Airport' 'Hornafjörður Airport' ...
 'Aerodromo de Castelo Branco' 'Ponte de Sor Airport'
 'Vilar de Luz Airfield']
['0' '-6']
In [15]:
from shapely.geometry import LineString

source_airports = new_airports[['airport_name', 'iata', 'icao',
                                'lat', 'long', 'timezone_name']]
destination_airports = source_airports.copy()
source_airports.columns = [str(col) + '_source' for col in source_airports.columns]
destination_airports.columns = [str(col) + '_destination' for col in destination_airports.columns]

routes = routes[['source_airport', 'destination_airport']]

routes = pd.merge(routes,
                  source_airports,
                  left_on='source_airport',
                  right_on='iata_source')
routes = pd.merge(routes,
                  destination_airports,
                  left_on='destination_airport',
                  right_on='iata_destination')
In [16]:
print(routes)
     source_airport destination_airport        airport_name_source  \
0               ABJ                 BOY         Port Bouet Airport
1               OUA                 BOY        Ouagadougou Airport
2               ABJ                 OUA         Port Bouet Airport
3               ABJ                 OUA         Port Bouet Airport
4               ABJ                 OUA         Port Bouet Airport
...             ...                 ...                        ...
3674            YHP                 YNO        Poplar Hill Airport
3675            YPM                 YNO         Pikangikum Airport
3676            YNO                 YHP  North Spirit Lake Airport
3677            YPM                 YHP         Pikangikum Airport
3678            ZSJ                 KEW         Sandy Lake Airport

     iata_source icao_source  lat_source  long_source timezone_name_source  \
0            ABJ        DIAP    5.261390    -3.926290                    0
1            OUA        DFFD   12.353200    -1.512420                    0
2            ABJ        DIAP    5.261390    -3.926290                    0
3            ABJ        DIAP    5.261390    -3.926290                    0
4            ABJ        DIAP    5.261390    -3.926290                    0
...          ...         ...         ...          ...                  ...
3674         YHP        CPV7   52.113300   -94.255600                   -6
3675         YPM        CYPM   51.819698   -93.973297                   -6
3676         YNO        CKQ3   52.490002   -92.971100                   -6
3677         YPM        CYPM   51.819698   -93.973297                   -6
3678         ZSJ        CZSJ   53.064201   -93.344398                   -6

       airport_name_destination iata_destination icao_destination  \
0        Bobo Dioulasso Airport              BOY             DFOO
1        Bobo Dioulasso Airport              BOY             DFOO
2           Ouagadougou Airport              OUA             DFFD
3           Ouagadougou Airport              OUA             DFFD
4           Ouagadougou Airport              OUA             DFFD
...                         ...              ...              ...
3674  North Spirit Lake Airport              YNO             CKQ3
3675  North Spirit Lake Airport              YNO             CKQ3
3676        Poplar Hill Airport              YHP             CPV7
3677        Poplar Hill Airport              YHP             CPV7
3678          Keewaywin Airport              KEW             CPV8

      lat_destination  long_destination timezone_name_destination
0           11.160100         -4.330970                         0
1           11.160100         -4.330970                         0
2           12.353200         -1.512420                         0
3           12.353200         -1.512420                         0
4           12.353200         -1.512420                         0
...               ...               ...                       ...
3674        52.490002        -92.971100                        -6
3675        52.490002        -92.971100                        -6
3676        52.113300        -94.255600                        -6
3677        52.113300        -94.255600                        -6
3678        52.991100        -92.836403                        -6

[3679 rows x 14 columns]
In [17]:
routes = routes[routes['timezone_name_source'] != routes['timezone_name_destination']]

routes_geometry = [LineString([[routes.iloc[i]['long_source'],
                                routes.iloc[i]['lat_source']],
                               [routes.iloc[i]['long_destination'],
                                routes.iloc[i]['lat_destination']]]) for i in range(routes.shape[0])]
routes_geodata = gpd.GeoDataFrame(routes, geometry=routes_geometry, crs='EPSG:4326')
In [18]:
fig, ax = plt.subplots(subplot_kw={'projection': ccrs.Mercator()},
                       figsize=(10,10))

ax.patch.set_facecolor('#FCF6F5FF')
routes_geodata.plot(ax=ax,
                    transform=ccrs.PlateCarree(),
                    color='black',
                    linewidth=0.1)
ax.axis('off')
plt.show()

In [19]:
fig, ax = plt.subplots(subplot_kw={'projection': ccrs.Mercator()},
                       figsize=(20,20))

countries.plot(ax=ax, transform=ccrs.PlateCarree(),
               color='none',
               edgecolor='black',
               lw=1)
data.plot(ax=ax,
          transform=ccrs.PlateCarree(),
          column='name',
          cmap='jet',
          edgecolor='white',
          lw=1,
          alpha=0.6)
routes_geodata.plot(ax=ax,
                    transform=ccrs.PlateCarree(),
                    color='black',
                    linewidth=0.1)
ax.axis('off')
plt.show()

Exercise
- Show the airports as well as the flight routes.
- Clip the image to only show the area where flights occur.
- Account for the curvature of the earth in your line projection.
In [20]:
print(new_airports.columns)
print(routes.columns)
Index(['id', 'airport_name', 'city', 'country', 'iata', 'icao', 'lat', 'long',
       'altitude', 'timezone', 'dst', 'tz', 'type', 'source', 'geometry',
       'index_right', 'objectid', 'scalerank', 'featurecla', 'timezone_name',
       'map_color6', 'map_color8', 'note', 'zone', 'utc_format', 'time_zone',
       'iso_8601', 'places', 'dst_places', 'tz_name1st', 'tz_namesum'],
      dtype='object')
Index(['source_airport', 'destination_airport', 'airport_name_source',
       'iata_source', 'icao_source', 'lat_source', 'long_source',
       'timezone_name_source', 'airport_name_destination', 'iata_destination',
       'icao_destination', 'lat_destination', 'long_destination',
       'timezone_name_destination', 'geometry'],
      dtype='object')
In [21]:
new_airports = new_airports.loc[new_airports['iata'].isin(routes.iata_source.unique().tolist() + routes.iata_destination.unique().tolist())]

fig, ax = plt.subplots(subplot_kw={'projection': ccrs.Mercator()},
                       figsize=(10,10))
countries.plot(ax=ax,
               transform=ccrs.PlateCarree(),
               color='none',
               edgecolor='black',
               lw=1)
data.plot(ax=ax,
          transform=ccrs.PlateCarree(),
          column='name',
          cmap='jet',
          edgecolor='white',
          lw=1,
          alpha=0.6)
routes_geodata.plot(ax=ax,
                    transform=ccrs.Geodetic(),
                    color='black',
                    linewidth=0.1)
new_airports.plot(ax=ax,
                  transform=ccrs.PlateCarree(),
                  color="red",
                  markersize=10)

ax.set_ylim(2000000, 9000000)
ax.set_xlim(-12000000, 1000000)
plt.show()
